Historical snapshots
The live graph answers "what does the cluster look like now?". Snapshots answer the follow-up SREs actually ask during an incident: "what changed?". When KubeAtlas records every resource add, update, and delete into an append-only event stream, the diff endpoint can replay a time window and tell you exactly which resources appeared, vanished, or were modified between two points.
Tier 2 only
Snapshots are a Tier 2 feature — they need the PostgreSQL backend. The event stream is an append-only table; a Tier 1 in-memory install has nowhere durable to keep it, and a feature that silently loses history on every Pod restart is worse than no feature at all.
This is enforced, not just documented:
- The Helm chart's
values.schema.jsonrejectssnapshots.enabled=trueunlesspersistence.enabled=true. - The snapshot API endpoints return
503 Service Unavailableon any install where the writer is not running — Tier 1, or Tier 2 withsnapshots.enabled=false.
The memory backend does carry a tiny fixed ring buffer of recent events, but that exists only so the unit tests have something to exercise. It is not a Tier 1 feature and is not exposed through the API.
How it works
informer event ──▶ Writer.Enqueue ──▶ bounded queue ──▶ worker pool ──▶ PostgreSQL
   (hot path)        (non-blocking)                       (N workers)    resource_events
The snapshot writer subscribes to the same informer pipeline that feeds the
live graph. Beginning with v1.5.2, every event is metadata-only: resource
payloads are cleared before entering the queue, and PostgreSQL enforces
resource_events.data IS NULL. The key property is that it never blocks the
informer:
Enqueueis non-blocking. It drops the event onto a bounded channel and returns immediately.- A pool of worker goroutines drains the channel into PostgreSQL in the background.
- If the queue is full — a burst arriving faster than the workers
can write — the writer sheds the oldest queued event rather
than stalling the informer. Every shed event increments
kubeatlas_snapshot_queue_drop_total.
Dropping under sustained overload is a deliberate trade: a slightly incomplete event stream is acceptable; an informer that falls behind the API server is not. In practice the queue absorbs normal churn comfortably — drops only appear under pathological write storms, and the diff endpoint is anchored by periodic full-sync markers (below) so a few missed deltas do not compound.
Full-sync markers
Alongside the event stream, KubeAtlas writes snapshot markers —
rows in snapshot_meta that record "at this timestamp the cluster
held N resources". A marker is a known-good anchor the diff walks
from. Markers are written:
- periodically, by the optional Helm
CronJob(snapshots.fullSyncSchedule), which calls the internal trigger endpoint; - manually, via
kubeatlas snapshot triggeror a directPOSTto the internal trigger endpoint.
GET /api/v1/snapshots lists these markers, most-recent first.
Retention
The event stream is pruned to a configurable window —
snapshots.retention, default 7d. An hourly background
retainer deletes every event older than the window in batched
DELETEs so the prune never holds a long transaction.
Retention bounds two things at once: the table's disk footprint,
and the maximum diff window. The diff endpoint rejects any
from/to window wider than the retention period — events beyond
the window have been pruned, so a wider diff would silently
under-report changes. Asking for more history than you keep is a
400, not a partial answer.
Reading the diff
The Web UI surfaces snapshot diffs in two places:
-
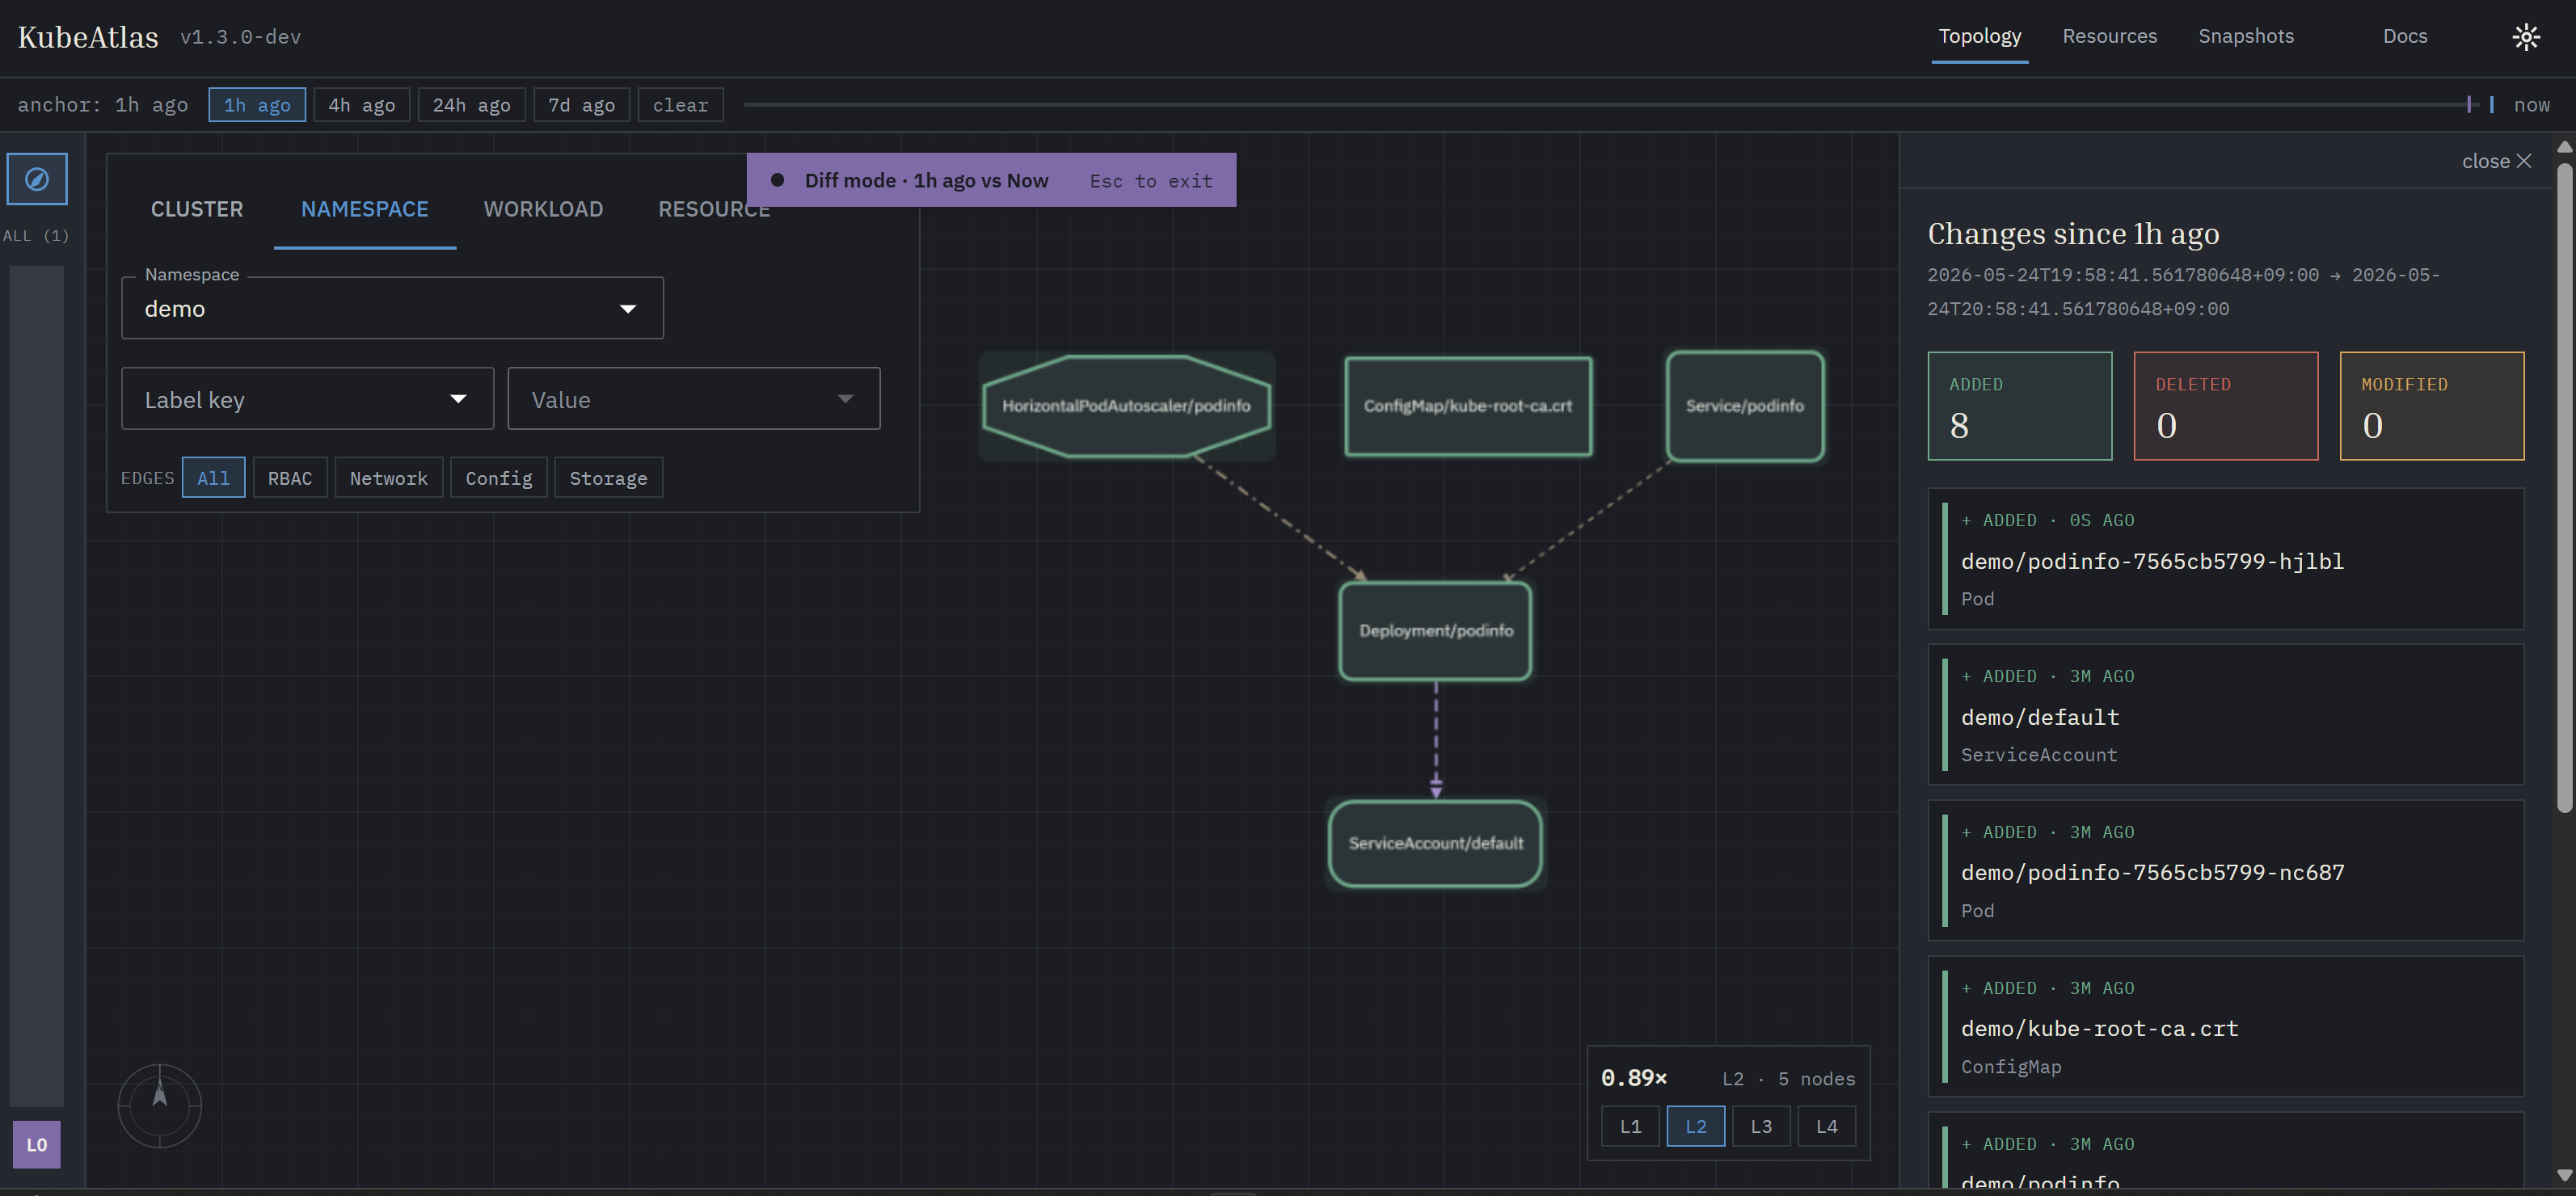
The time-axis rail at the top of the topology canvas — pick an anchor (preset chip or drag the rail itself) and the canvas enters diff mode: added resources gain a green halo, removed ones drop to a dashed muted outline, modified ones get an amber overlay. Esc clears.
-
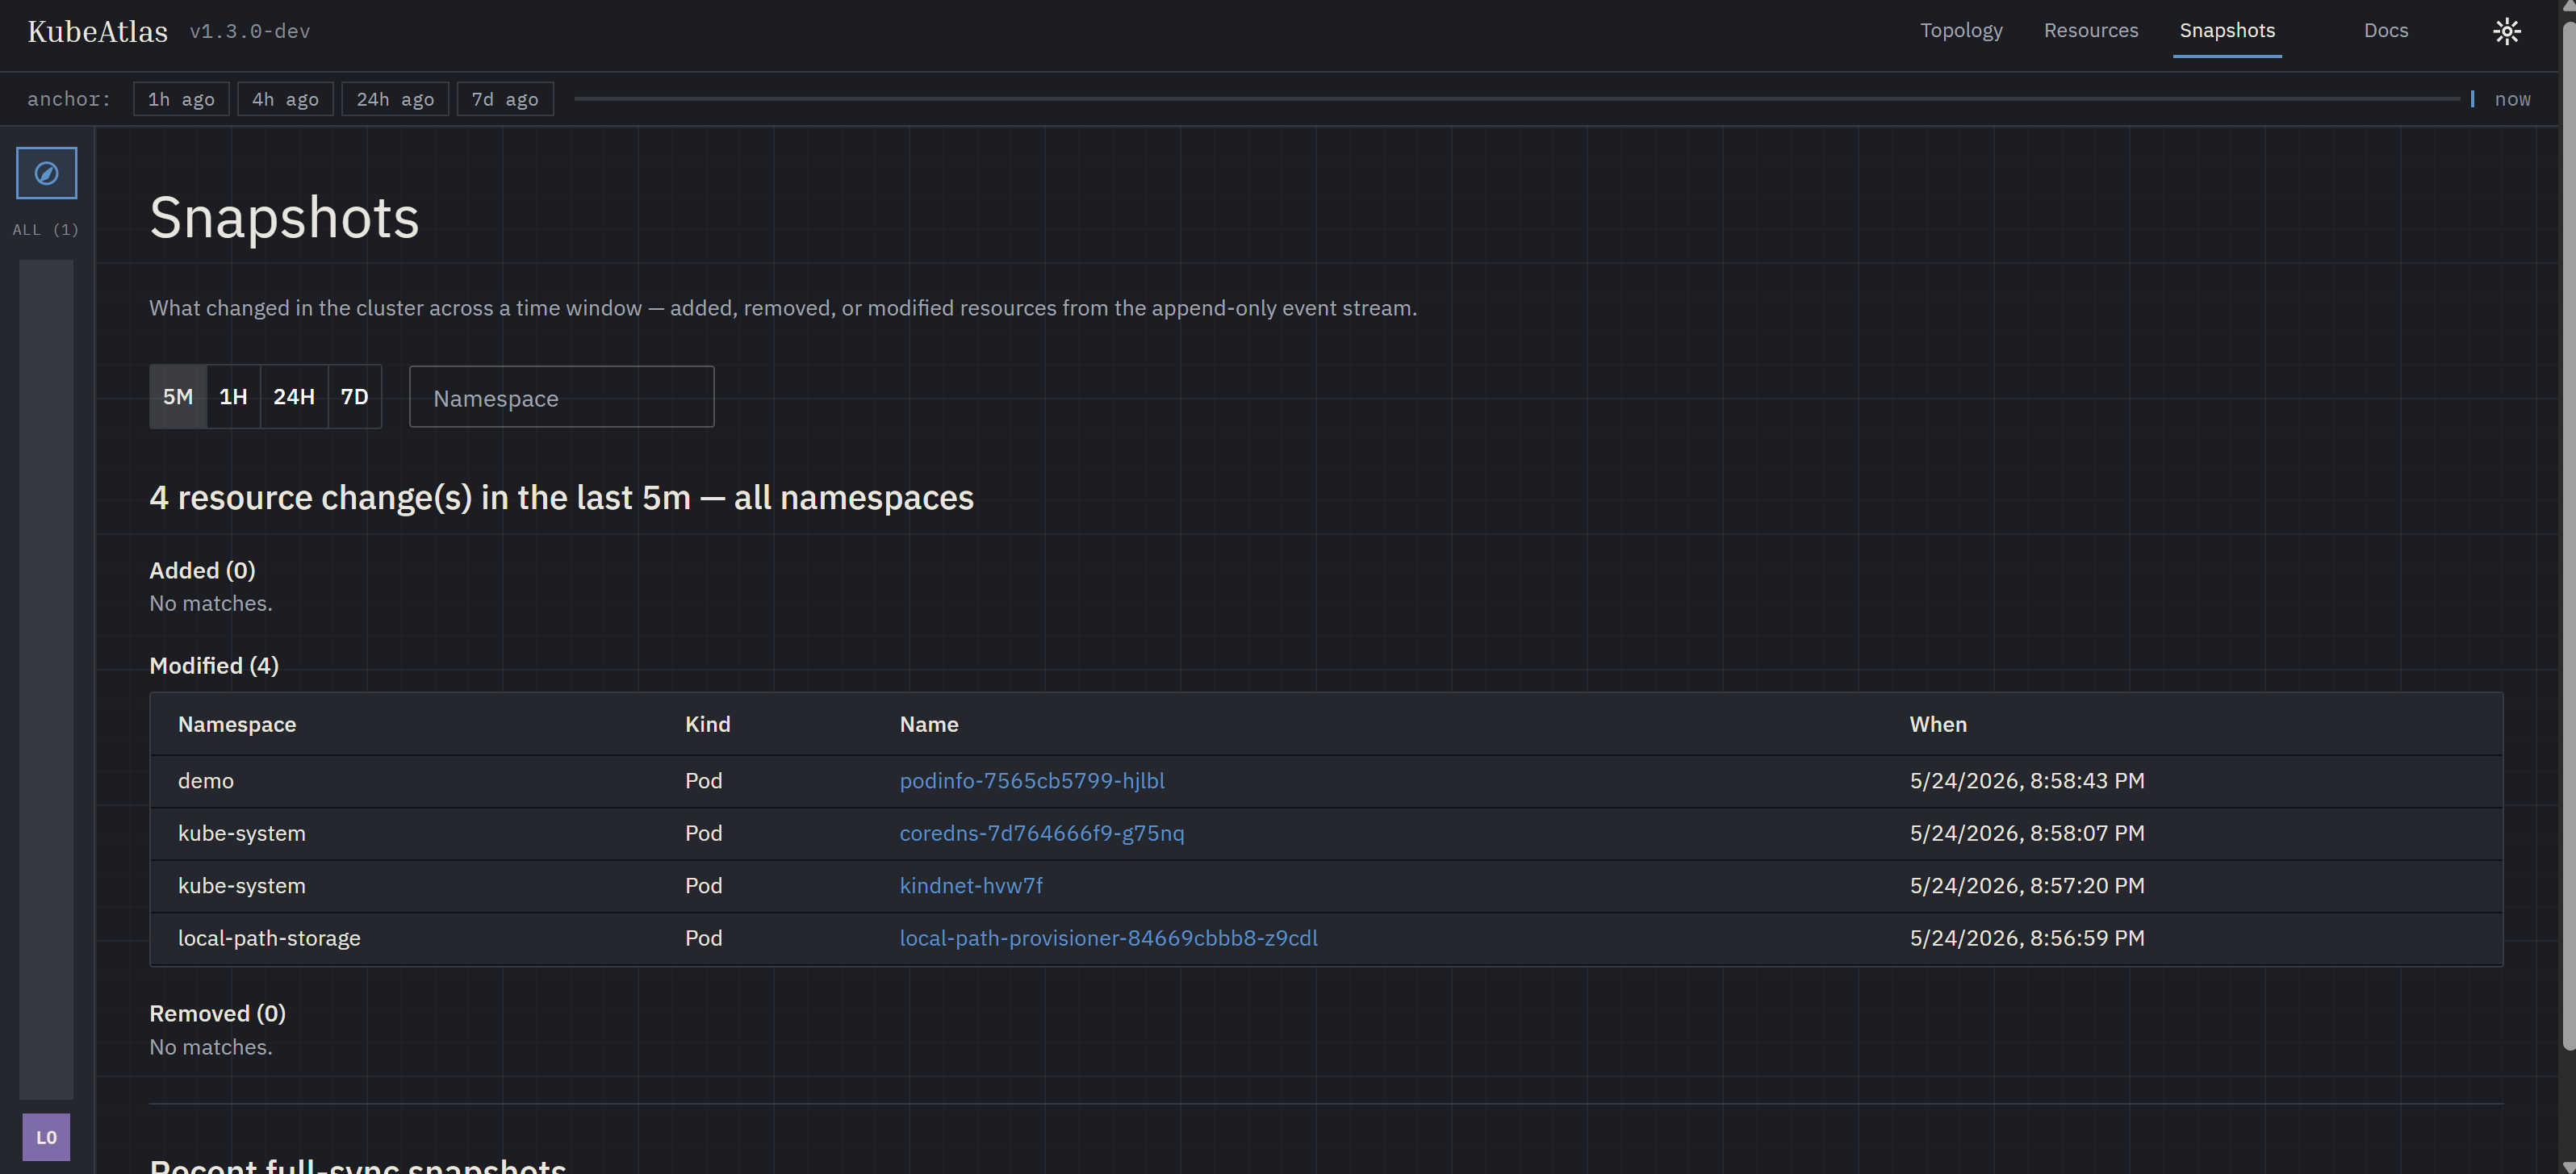
The dedicated Snapshots page — a window-picker driven view with three tables (Added / Removed / Modified) plus a timeline of recent full-sync markers; the same data the API surfaces, in a denser tabular form.
Under both, the wire format is the same:
GET /api/v1/snapshots/diff?from=1h&to=now replays the event
stream across the window and classifies every resource that
appears in it:
| Bucket | Meaning |
|---|---|
added | First event in the window is an add; no later delete |
removed | Last event in the window is a delete |
modified | Seen, but neither freshly added nor removed |
from and to accept now, a duration read as "ago"
(5m, 1h, 7d), or an absolute RFC3339 timestamp. to defaults
to now. An optional namespace restricts the diff to one
namespace; omit it for the whole cluster.
The diff and its backing event table contain resource identity and metadata — kind,
namespace, name, UID — not full resource bodies. It tells you
what changed and when; reach for kubectl or your audit log
for the field-level how.
See the API reference for the full request and response shapes.
Enabling snapshots
Install CloudNativePG 0.22.1 first as described in Persistence (Tier 2), then enable both persistence and snapshots:
helm upgrade --install kubeatlas oci://ghcr.io/lithastra/charts/kubeatlas \
  --version 1.5.1 \
  --namespace kubeatlas --create-namespace \
  --set persistence.enabled=true \
  --set persistence.embedded.enabled=true \
  --set snapshots.enabled=true \
  --set snapshots.retention=7d
Tuning knobs, all under snapshots in values.yaml:
| Value | Default | What it controls |
|---|---|---|
enabled | false | Master switch (requires persistence.enabled) |
retention | 7d | Event-stream window and max diff width |
queueSize | see chart | Writer queue capacity before drop-oldest kicks in |
workers | see chart | Number of goroutines draining the queue into PG |
fullSyncSchedule | see chart | Cron schedule for the periodic full-sync marker |
Observability
The writer exports Prometheus metrics on /metrics when it is
running:
| Metric | Type | Meaning |
|---|---|---|
kubeatlas_snapshot_events_processed_total | counter | Events durably written to PostgreSQL |
kubeatlas_snapshot_queue_drop_total | counter | Events shed at enqueue under queue-full backpressure |
kubeatlas_snapshot_write_failed_total | counter | Events dropped after the per-event retry budget was exhausted |
kubeatlas_snapshot_queue_depth | gauge | Events currently buffered in the writer queue |
A healthy install shows processed_total climbing with cluster
churn and both drop counters flat at zero. A steadily rising
queue_drop_total means the queue cannot keep up — raise
snapshots.workers or snapshots.queueSize. A rising
write_failed_total instead points at PostgreSQL itself —
check the database's health and connectivity.